|
Used formulas:
rc = 0.03 * (Tw * dwl + Twg * dsl)
i = precipitation / duration precipitation
rca = rc - 2.497 * i0.68 - 1.524 * i0.34 -
0.235;
sp = rc - rca
Tw: maximum wet bulb temperature
Twg: wet bulb temperature at surface
dwl: thickness warm layer
dsl: thickness stable layer
rc: critical amount of precipitation for snow
rca: critical amount of precipitation for wet snow
sp: melting layer parameter
Source:
Ivens, A.A.M., Forecasting the kind of precipitation in winter.
Proc. Symp. Mesoscale Analysis & Forecasting, Vancouver, Canada, 17-19
August 1987, ESA SP-282 (August 1987).
|
Theta-W
From the greek letter 'theta' and subscript 'w', used to
denote wet bulb potential
temperature (q.v.) - one of a group of pseudo-conservative (q.v.) properties
of air masses.
wet bulb potential
(often abbreviated to WBPT, or 'theta-W') A relatively conservative property
within any one air mass that is derived from the temperature and humidity
values of a particular air sample for a particular level: usually 850 or 500
hPa. Very warm/very humid
southerlies for example (in NW Europe) would have typical 850hPa WBPT values
well in excess of 16 degC, and perhaps as high as 20 degC or more;
polar maritime air
streams would have values typically 5 to 10 degC, but these values would be
much lower in the depths of winter.
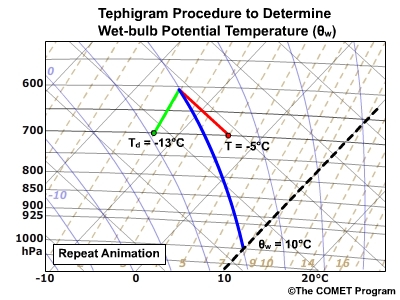
From the wet-bulb temperature, follow the
saturation adiabat to the 1000 hPa isobar.The
isotherm value at this intersection equals the wet-bulb potential
temperature at the given pressure.
In this example, air at 700 hPa with T = -5°C and Td = -13°C
has a wet-bulb temperature of -7°C and a wet-bulb potential temperature of
10°C.
Thickness' is a measure of how warm or cold a layer of the atmosphere is,
usually a layer in the lowest 5 km of the troposphere;
high values mean warm air, and
low values mean cold
air.
It would be perfectly feasible to define the average temperature of a
layer in the atmosphere by calculating its mean value in degrees C (or
Kelvin) between two vertical points, but an easier, practical way to measure
this same mean temperature between two levels can be gained by subtracting
the lower height value of the appropriate isobaric surface from the upper.
Thus one measure of thickness commonly quoted is = height (500 hPa surface)
- height (1000 hPa surface)
Advection is simply the meteorologists word for movement of air in bulk.
When we talk about warm advection, we mean that warm air replaces colder
air, and vice-versa. These 'bulk' movements of air of differing temperatures
can be seen very well on thickness charts, and differential advection,
important in studies of stabilisation / de-stabilisation, can also be
inferred by considering advection of partial thicknesses.
Total Thickness (500-1000 hPa) isopleths (when shown in combination with
other fields) are conventionally drawn as long-dash lines, with the values
either thus [540] or white numerals on a black/solid rectangle. Certain
isopleths are considered 'standard', mainly for historical reasons: They are
listed hereunder, with the colour code convention used by the UK Met.Office
on internal charts.
474 - red
492 - purple
510 - brown 528 - blue
546 - green
564 - red 582 - purple
Rain and snow are equally likely when the 500-1000 hPa
thickness is about 5225 gpm (or 522 dam).
Rain is rare when the 500-1000 hPa thickness is less than 5190 gpm.
Snow is extremely rare when the 500-1000 hPa thickness is greater than 5395
gpm
sources :
http://weatherfaqs.org.uk
http://www.skystef.be
http://www.meted.ucar.edu
