General thunderstorm (instability) indicators
| Index | Weak (low) | Moderate | Strong (high) |
| Surface based CAPE | 300 to 1000 | 1000 to 2500 | > 2500 |
| Surface based Lifted-Index | 0 to -2 | -3 to -5 | < -5 |
| Convective Inhibition | > 50 | 50 to 200 | > 200 |
| Total-totals | > 42 | > 48 | > 50 |
| K-Index | 20 to 25 | 26 to 35 | > 35 |
| KO-Index | > 6 | 2 to 6 | < 2 |
| Showalter Stability Index | > 2 | =< 2 | |
| Thompson Index | 24 to 34 | 35 to 39 | => 40 |
| Jet stream | |||
| Storm Relative Helicity 0-3 km | 150-300(Possible supercell) | 300-400(Supercells) | 400+Tornadic possible |
| Thunderstorm Index | |||
| K = K Index in °C TT = total totals index in °C PW = precipitable water for the entire sounding in cm Temp = temperature on ground in °C Dewp = dewpoint on ground in °C θS = equivalent potential temperature in °K (= measure for instability) LI = lifted index in °C CAPE = convective available potential energy in J/kg CIN = convective inhibition in J/kg EH = environmental helicity in m²/s² SREH = storm relative environmental helicity in m²/s² StrmDir = storm direction in degrees StrmSpd = storm speed in knots |
EXAMPLE HODOGRAPH SKETCH #3 Strong speed shear and strong directional shear: supercell thunderstorm 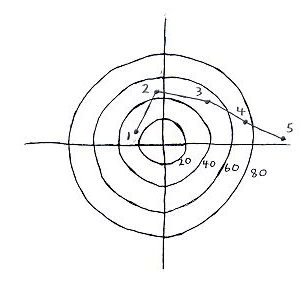 SKETCH 3: ESE 24 knots 950 mb, S 43 knots 850 mb, SW 52 knots 700mb, WSW 77 knots 500 mb, W 95 knots 300 mb |
EXAMPLE HODOGRAPH SKETCH #1 Weak speed shear and weak directional shear or weak speed shear and strong directional shear: single cell . 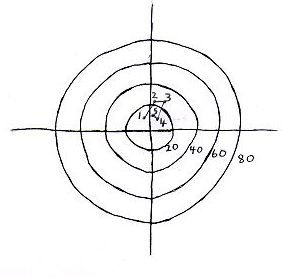 SKETCH 1: SSE 10 knots 950 mb, S 22 knots 850 mb, SSW 23 knots 700mb, SW 10 knots 500 mb, S 13 knots 300 mb |
EXAMPLE HODOGRAPH SKETCH #2 Strong speed shear and weak directional shear: multicell thunderstorm. If deep layer speed shear (sfc-6km is >35 knots): risk for supercell thunderstorm which might split in a twin pair if directional shear is straight. 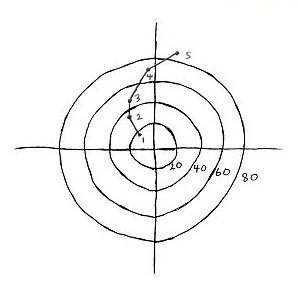 SKETCH 2: SE 19 knots 950 mb, SE 35 knots 850 mb, SSE 45 knots 700mb, S 70 knots 500 mb, SSW 85 knots 300 mb |